Appel’s Moving Average Trading Systems is authored by Gerald Appel, the creator of the MACD technical indicator. Skeptical of all second-hand processed knowledge, I decided to pick up and read this book. Thinking in reverse, searching for the title of this book on social media should also yield information that can genuinely help us.
The very first sentence of the preface made up my mind to read this book cover to cover: “If you have been hurt by naively trusting your brokerage firm, your familiar mutual fund manager, or blindly trusting those popular trading gurus, then this book was written specifically for you.”
At the same time, the author promises in the preface that the two technical indicators covered in Chapter 1 require only 5 to 10 minutes of analysis time per week—enough for investors to judge whether the market climate is favorable or unfavorable for trading. Even if you stop reading after Chapter 1, you will already have mastered very useful analytical tools capable of enhancing your investment performance.
Although successful investing is simple—what to buy and sell, and when to buy and sell—there are rarely clear explanations of technical indicators. Let us step onto the “millionaire fast lane” through this book.
#1 Super Practical Investment Strategies
The Primary Principle of Selecting Investment Tools
- What matters is not how much you can earn, but how much you are prepared to lose.
To make up for losses in the stock market, you must generate a gain percentage greater than the percentage lost. The order in which losses and gains occur does not matter.
To ensure long-term investment success, preserving principal is far more important than achieving occasional windfall profits.
Overall, if investors primarily put their money into high-risk funds, their final profits are actually not significant. Over the long run, fund groups with low volatility and high volatility yield essentially the same investment returns, but the former carries lower risk.
Conclusion: Returns from investing in high-volatility stocks are lower than returns from investing in low-volatility stocks.
Relative Strength Investing Strategy—Consistently Holding the Optimal Portfolio
The basic principles are as follows:
- Identify leading stocks
- Buy leading stocks
- Hold leading stocks as long as they maintain their leadership position
- When leading stocks begin to slow down their upward speed, sell them and buy new leading stocks
From a pool of mutual funds, pick and buy at least two, preferably four to five mutual funds that ranked in the top 10% of performance over the past three months (mutual funds among the top ten whose volatility is approximately equal to or does not exceed that of the S&P 500 index).
Even a portfolio with only two funds offers greater safety than a portfolio with just one fund. It works even better to look for funds that waive purchase and redemption fees as long as they are held for more than 90 days.
With the release of new quarterly report data, investors should review their portfolio every three months. If the performance of any single fund drops out of the top 10%, sell it and replace it with another fund that has remained in or just entered the top 10%. Continue holding the remaining funds whose current performance stays in the top 10%.
By following this process, you can rebalance and reallocate your mutual fund portfolio from time to time, holding a mutual fund portfolio that consistently outperforms the industry average in every quarter. Ultimately, your portfolio will consist of the top-performing mutual funds, akin to placing bets on racehorses that lead in every lap.
Conclusion: Over the long term, even if adopting a more aggressive investment strategy brings additional returns, those extra gains are very limited.
Conclusion 2: Increasing the volatility of a mutual fund portfolio does not significantly boost returns, whereas the risk level genuinely increases. Therefore, as a general rule, you should stick to focusing your investments on mutual funds with below-average volatility.
Three Steps to Managing a Mutual Fund Portfolio
- You need a data source capable of accessing price and volatility data for at least 500 mutual funds (the more, the better) for the most recent quarter.
- Open a mutual fund investment account capable of portfolio diversification to invest in mutual funds that ranked in the top 10% of performance in the previous quarter and have a volatility lower than the S&P 500 index—with the volatility of these mutual funds not exceeding the average volatility of the entire portfolio at most.
- At the beginning of each new quarter, eliminate funds that have fallen out of the top 10% and replace them with newly entering top-10% mutual funds.
#2 Two Easy-to-Use Stock Market Indicators
Monetary Indicator
The stock market performs best when interest rates are steadily falling, and worst when interest rates are steadily rising.
Nasdaq/NYSE Relative Strength Indicator
When the relative strength of the Nasdaq Composite Index leads the New York Stock Exchange Index, the probability of a market rise increases significantly.
The total annualized return of investing with the Nasdaq/NYSE ratio method is far higher than the buy-and-hold strategy, yet the time committed to investing is only a little over half of the latter—for those looking to reduce their effort and time spent in the stock market, this indicator can also be used when making standalone buying and selling decisions.

#3 Moving Averages and Rate of Change (ROC) Indicator: Tracking Trend and Momentum
Moving average systems are used to smooth out the “noise” of short-term price fluctuations, making it easier for investors to identify and define major market trends.
Always monitor the slope of the moving average and the height of its fluctuations: the longer the impulse lasts and the steeper the slope, the higher the probability of a sustained trend; if the slope and impulse begin to flatten, the risk of a market reversal becomes imminent. (Crossover above and below signals mark above-average rises or below-average declines, respectively.)
When studying moving average trading channels, we need to combine them with Elliott Wave Theory (which states that market trends continuously repeat a pattern, where each cycle consists of 5 impulse waves upward and 3 corrective waves downward), as it serves as a highly effective market timing tool.
Interpretation and Application of the Rate of Change (ROC) Indicator
ROC = (Today’s Closing Price - Closing Price n days ago) / Closing Price n days ago
When ROC rises to a relatively high level, it is called an overbought state and is usually regarded as a sell signal. When ROC falls to a relatively low level, it is called an oversold state and is usually regarded as a buy signal.
When ROC crosses above the zero line from below, it indicates that buyers are strong, serving as a buy signal; crossing from above to below serves as a sell signal.
A pattern where prices reach new highs while momentum indicators decline is called a bearish divergence (top divergence). The occurrence of a bearish divergence signals an impending bear market, because the momentum pushing the market up fails to keep pace with the rise in market prices, causing upward strength to weaken and leading inevitably to a decline. Conversely, when momentum readings rise continuously while price levels fall to new lows, this reflects that downward momentum is gradually waning. This is called a bullish divergence (bottom divergence), which is a signal of an approaching bull market. However, divergence alone cannot serve as a trading signal and should be analyzed in combination with the ROC moving average.
The 10-day ROC indicator is very useful for short-term trading, while 21-day to 25-day ROC indicators are commonly used for medium-term trading analysis. Combining short-term and long-term ROC indicators can be extremely advantageous for trading. The specific method is: use the readings of the short-term ROC indicator to make an initial forecast of the trend direction first, and then use the long-term ROC indicator to confirm the direction.

In most cases, the starting point of a significant market rally is not when the ROC and other momentum indicators reach their lowest readings or are in the oversold territory; rather, it often begins after momentum indicators have already been rising from their lowest readings for some time. For example, when the rally in October 2002 began in the figure above, the 21-day ROC indicator had already constructed a bullish double-bottom pattern—with the second low higher than the previous low.
However, as in Region C, when prices reached their peak in November, the ROC indicator was in a continuous downtrend. This is a classic bearish divergence, signaling future market weakness.
Triple-Momentum Nasdaq Index Trading Model
A market timing model based on the principle of “fight when you can win, run when you can’t.” It enables investors to effectively avoid trades with low probability of profit, thereby significantly reducing trading risks.

Maintain three daily-level ROC indicators: a 5-day ROC of the Nasdaq Composite Index closing price, a 15-day ROC indicator, and a 25-day ROC indicator.
For example, if today’s closing price is 2000 and it was 1900 10 days ago, the value of the 10-day ROC is +5.26% (2000 - 1900 = 100; 100 / 1900 = 0.0526; 0.0526 * 100 = +5.26%).
At the close of each trading day, add up the percentage-based values of the 5-day, 15-day, and 25-day ROC indicators to obtain a composite ROC value—today’s triple-momentum value. For example: +3.0% for 5-day, +4.5% for 15-day, and +6% for 25-day would result in a triple-momentum value of +13.5%, indicating that the index has crossed upward across all timeframes, signaling an impending market rise.
There is only one rule for buying and selling: buy when the specific value of the triple-momentum indicator—the sum of the 5-day, 15-day, and 25-day ROC readings—crosses above 4% from below, and sell when it breaks below 4% from above.
There are no other rules; this is a model so simple it is elegantly perfect.


#4 Beyond Charts: Powerful Technical Graphic Tools
Synergy
Refers to the combined effect produced by adding or blending two or more analytical tools together being greater than the sum of their individual applications—commonly known as 1 + 1 > 2.
There is no perfect stock market indicator, nor even any near-perfect indicator. Taking a step back, even if a perfect technical indicator existed, its secrets would eventually become common knowledge, and as investors began following it collectively, its effectiveness would diminish day by day. Even the best predictions are imperfect, achieving success only within a certain probability at best. A relatively realistic goal is to make correct decisions as often as possible, developing the ability to quickly recognize mistakes, take appropriate action, and adjust one’s mindset properly—even if it means accepting losses in the stock market (in general, the best way to handle losses in the stock market is to cut losses quickly).
Successful investors do not hold security positions continuously. They evaluate the probability of success for a given opportunity as carefully as possible and invest only when the odds are favorable. One method to increase the probability of winning is applying synergy: if multiple indicators mutually confirm expectations of stock market movements, the probability of trading success increases dramatically. (For example, a single indicator has a 60% success rate, two indicators combined reach 84%, and three indicators reach 93.6%.)
Price Forecasting Based on Angular Changes
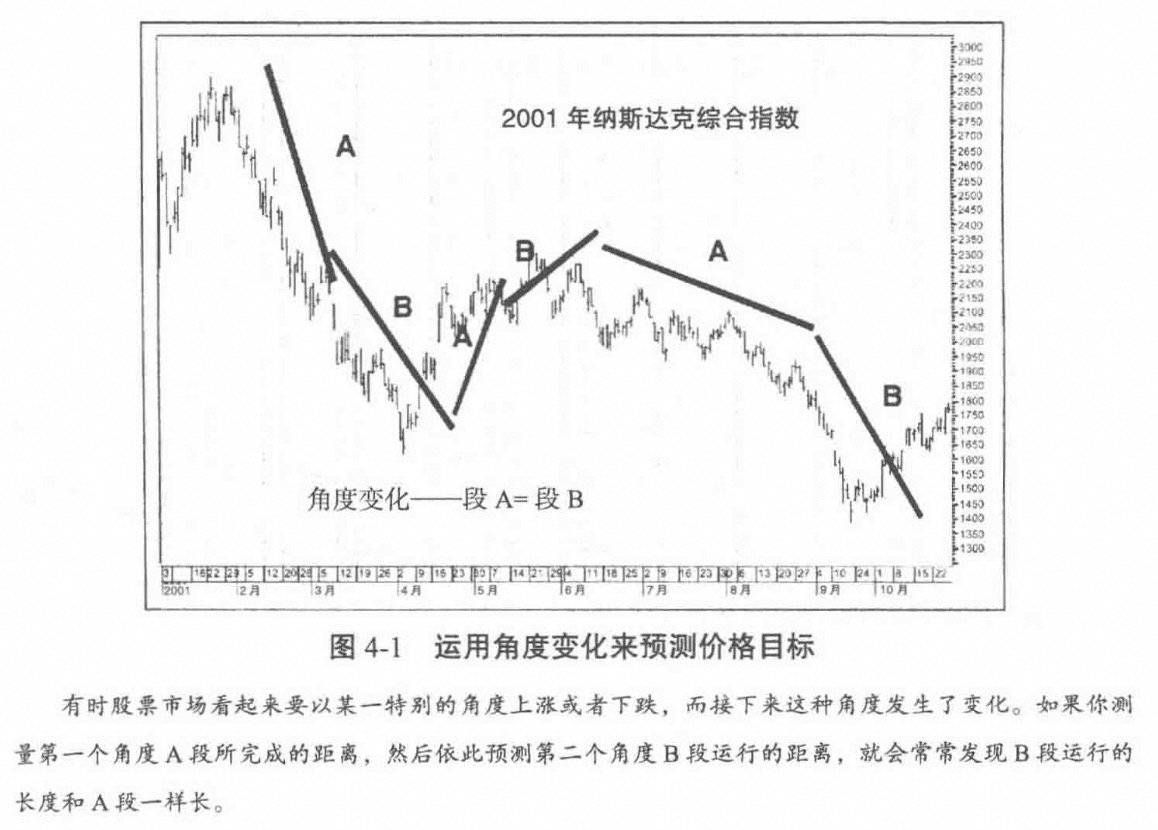
If trading volume is relatively light during a steep rally or decline, the angle of price movement can easily change and become flatter. Conversely, a steadily rising or falling market may suddenly experience a change in slope, moving at an almost vertical angle.
When such a pattern is identified, you should currently be at the early stage of the second segment, at which point you can accurately forecast the magnitude and remaining duration of the market movement. The specific procedure takes two steps: Step 1, calculate the total time along the angle of the first rise or fall, referred to as Segment A; Step 2, once you identify a change in the price movement angle relative to Segment A, immediately proceed to measure the length of the second segment, referred to as Segment B. The specific measurement method is to project out from the starting point of Segment B, plotting a complete trend forecast using the length of Segment A along the angle of Segment B. This enables you to forecast not only the extension length of Segment B, but also the runtime duration of Segment B.
That’s all for Part 1 for now. Since I haven’t figured out how to apply this to the A-share market, and because studying these might not be as straightforward as directly investing in US stock indices, I won’t continue reading further until I figure it out.