Have any of you ever invested in stocks? How do you pick your stocks?
Is it by checking Alipay’s “Gold Selection” recommendations? Watching KOL videos with random analysis? Listening to strong recommendations from others? Or just sorting by yield and picking one with your eyes closed?
To be honest, I’ve done all of these, but they only brought me huge losses in my account, stomach aches in the middle of the night that kept me awake, and a painful daily routine of frantically refreshing apps in hopes that prayers would make the chart go up.
Looking at it calmly, if Lu Benwei is a “gambling monster”, then these behaviors make one a total “gambling dog” acting like a naive leek.
The win rate of these behaviors is even lower than the 50% win rate of rolling dice or flipping a coin. Heading stubbornly into the market without adequate learning, reflection, and trial-and-error is worse than donating to charity.
Therefore, this article will learn and document the meanings of stock F10 technical indicators.
In my view, technical indicators are not only an important basis for stock selection, but also a dictionary or “slang” for discussing with others.
If you don’t know what they mean, how can you align underlying logic, match granularity, execute a combined punch, and empower stock selection strategies?
This article does not cover real-time trend indicators such as MACD, KDJ, and CCI, but only analyzes F10 technical indicators related to financial reports.
Risk Warning & Disclaimer: The above content does not constitute any financial marketing or investment solicitation, nor does it constitute any investment advice. Before making any investment decision, investors should consider the risk factors associated with investment products based on their own circumstances and, when necessary, consult professional investment advisors for advice.
What is F10 & Where to Find It
F10 is also known as the fundamental data of a company and stock. It gets its name “F10” because the F10 button in stock trading software brings up the data dashboard interface.
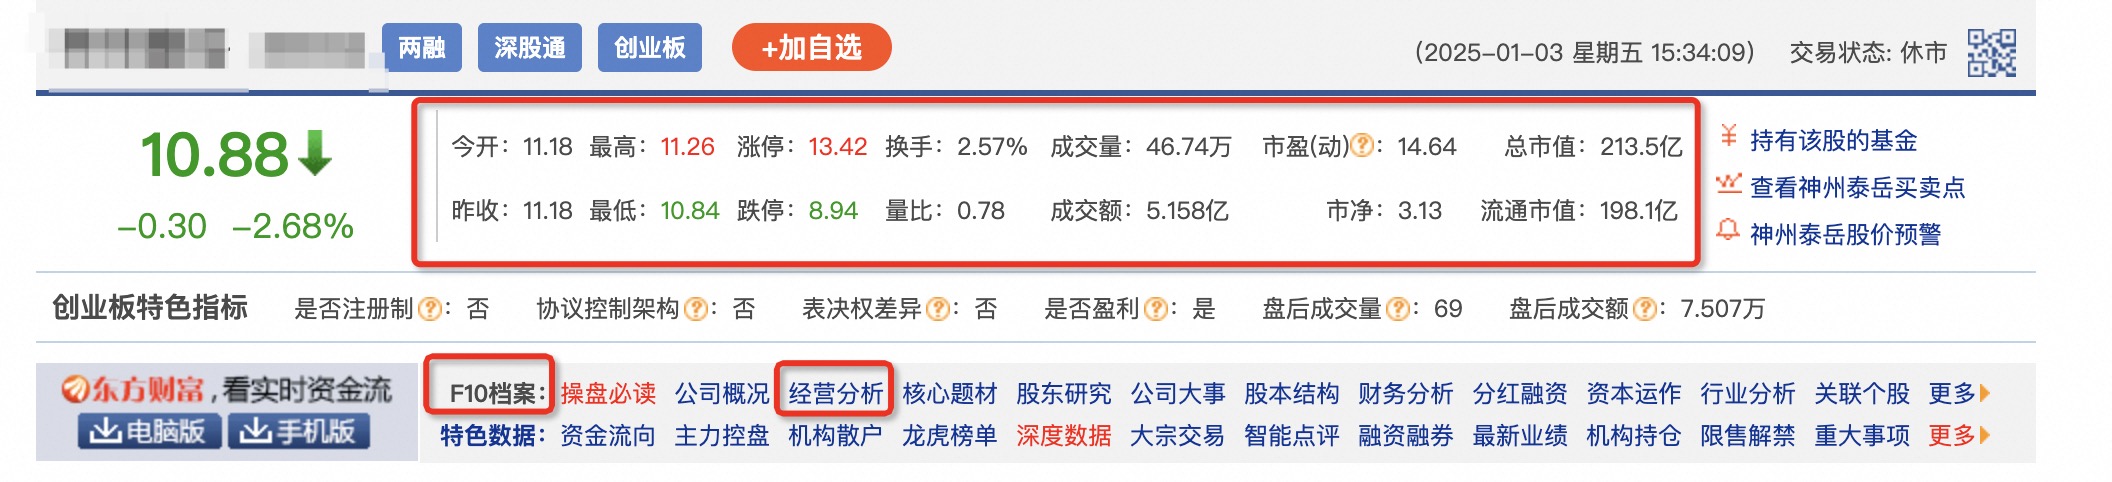
Open the East Money website, and to the right of the current price and percentage change, you can see basic and important data.
The fact that this data is placed here means it is extremely important; otherwise, it wouldn’t occupy a top position.
However, due to space limitations, more data needs to be viewed in the F10 files below.
Indicator Structure & Connections
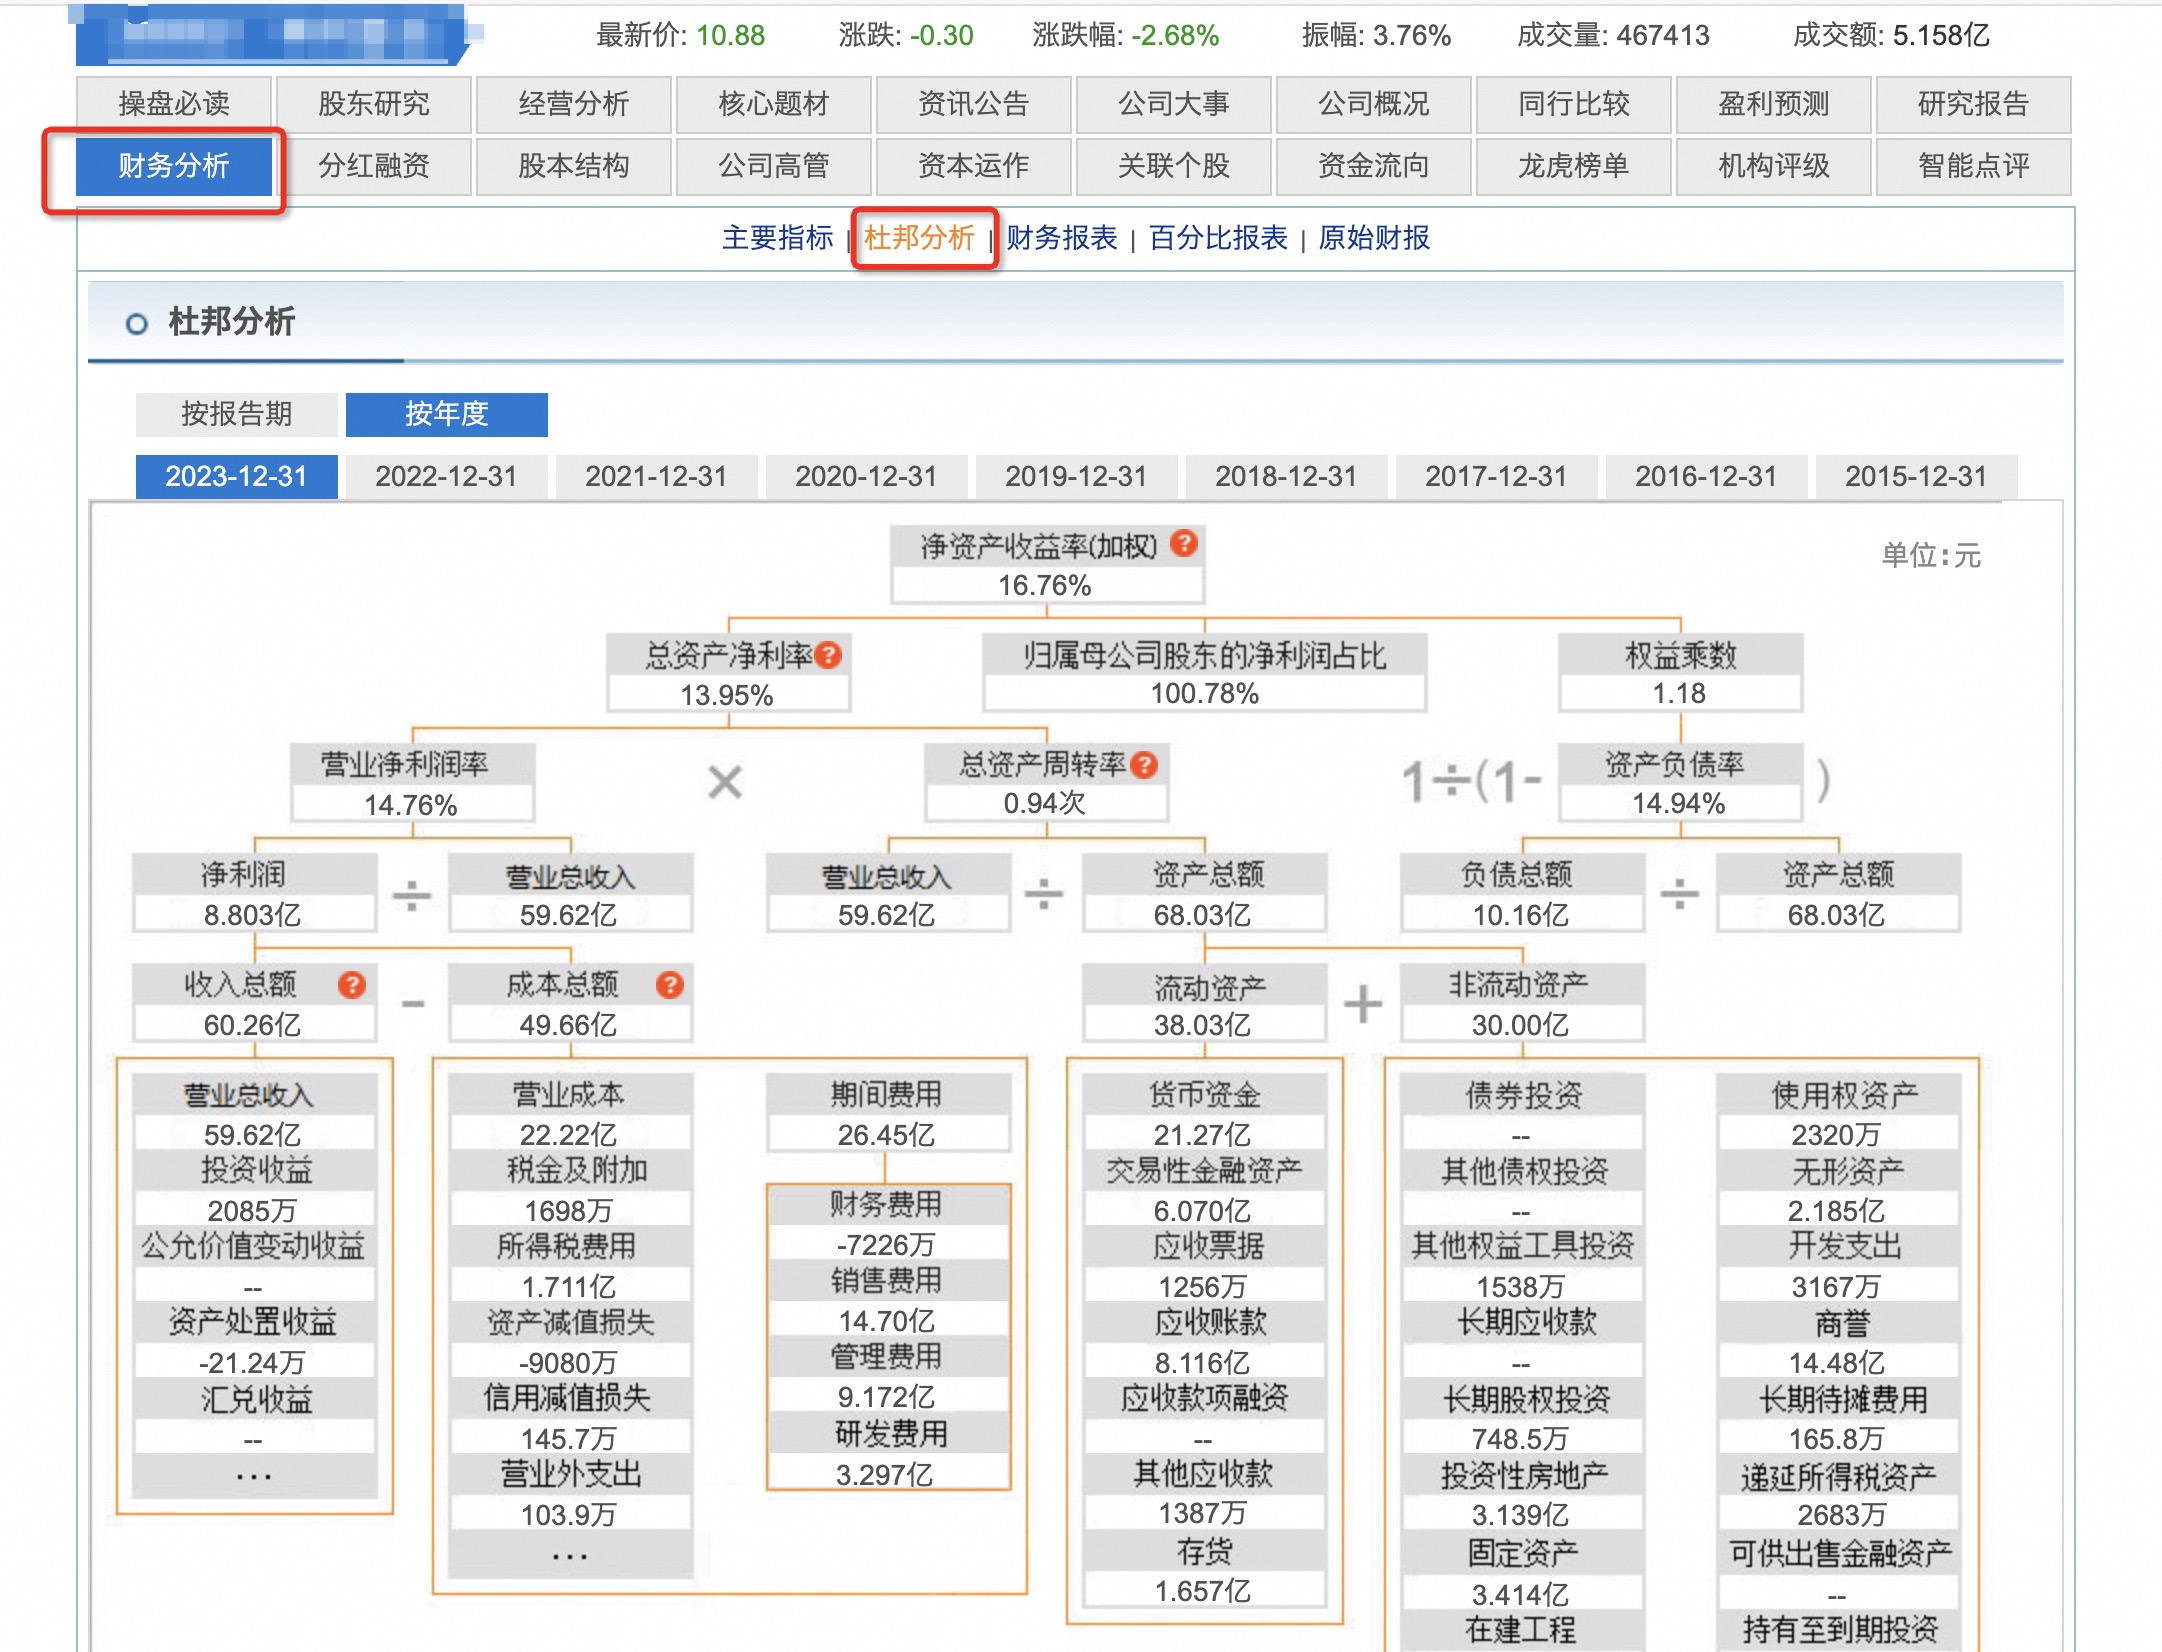
Multiple indicators are certainly not independent of each other. How indicators are calculated can be viewed via [Financial Analysis] → [DuPont Analysis].
Indicator data is generally obtained from annual reports. Such indicators are relatively static, meaning they remain unchanged for several months.
Although fundamental financial indicators provide a data foundation for stock selection, in a volatile stock market, they should be analyzed in combination with dynamic indicators as much as possible.
Indicator Descriptions
Basic Composition of Indicators
P Total Market Value / Share Price — Price
E Net Profit / Earnings Per Share — Earning
B Net Assets — Book Value — The remaining portion of a company’s total assets minus total liabilities
R Return — Return
ROE — Return on Equity
If I had to choose only one metric to pick stocks, I would choose ROE (Return on Equity). Companies whose ROE can remain consistently above 20% year after year are good companies, and investors should consider buying them. — Warren Buffett
It is generally used to evaluate a company’s ability to generate profits using shareholders’ equity.
Assuming a company has a net profit of 2 million RMB and shareholders’ equity of 10 million RMB in a fiscal year, its ROE is:
This also means that for every 1 RMB of shareholders’ equity used, the company can generate 0.20 RMB in net profit.
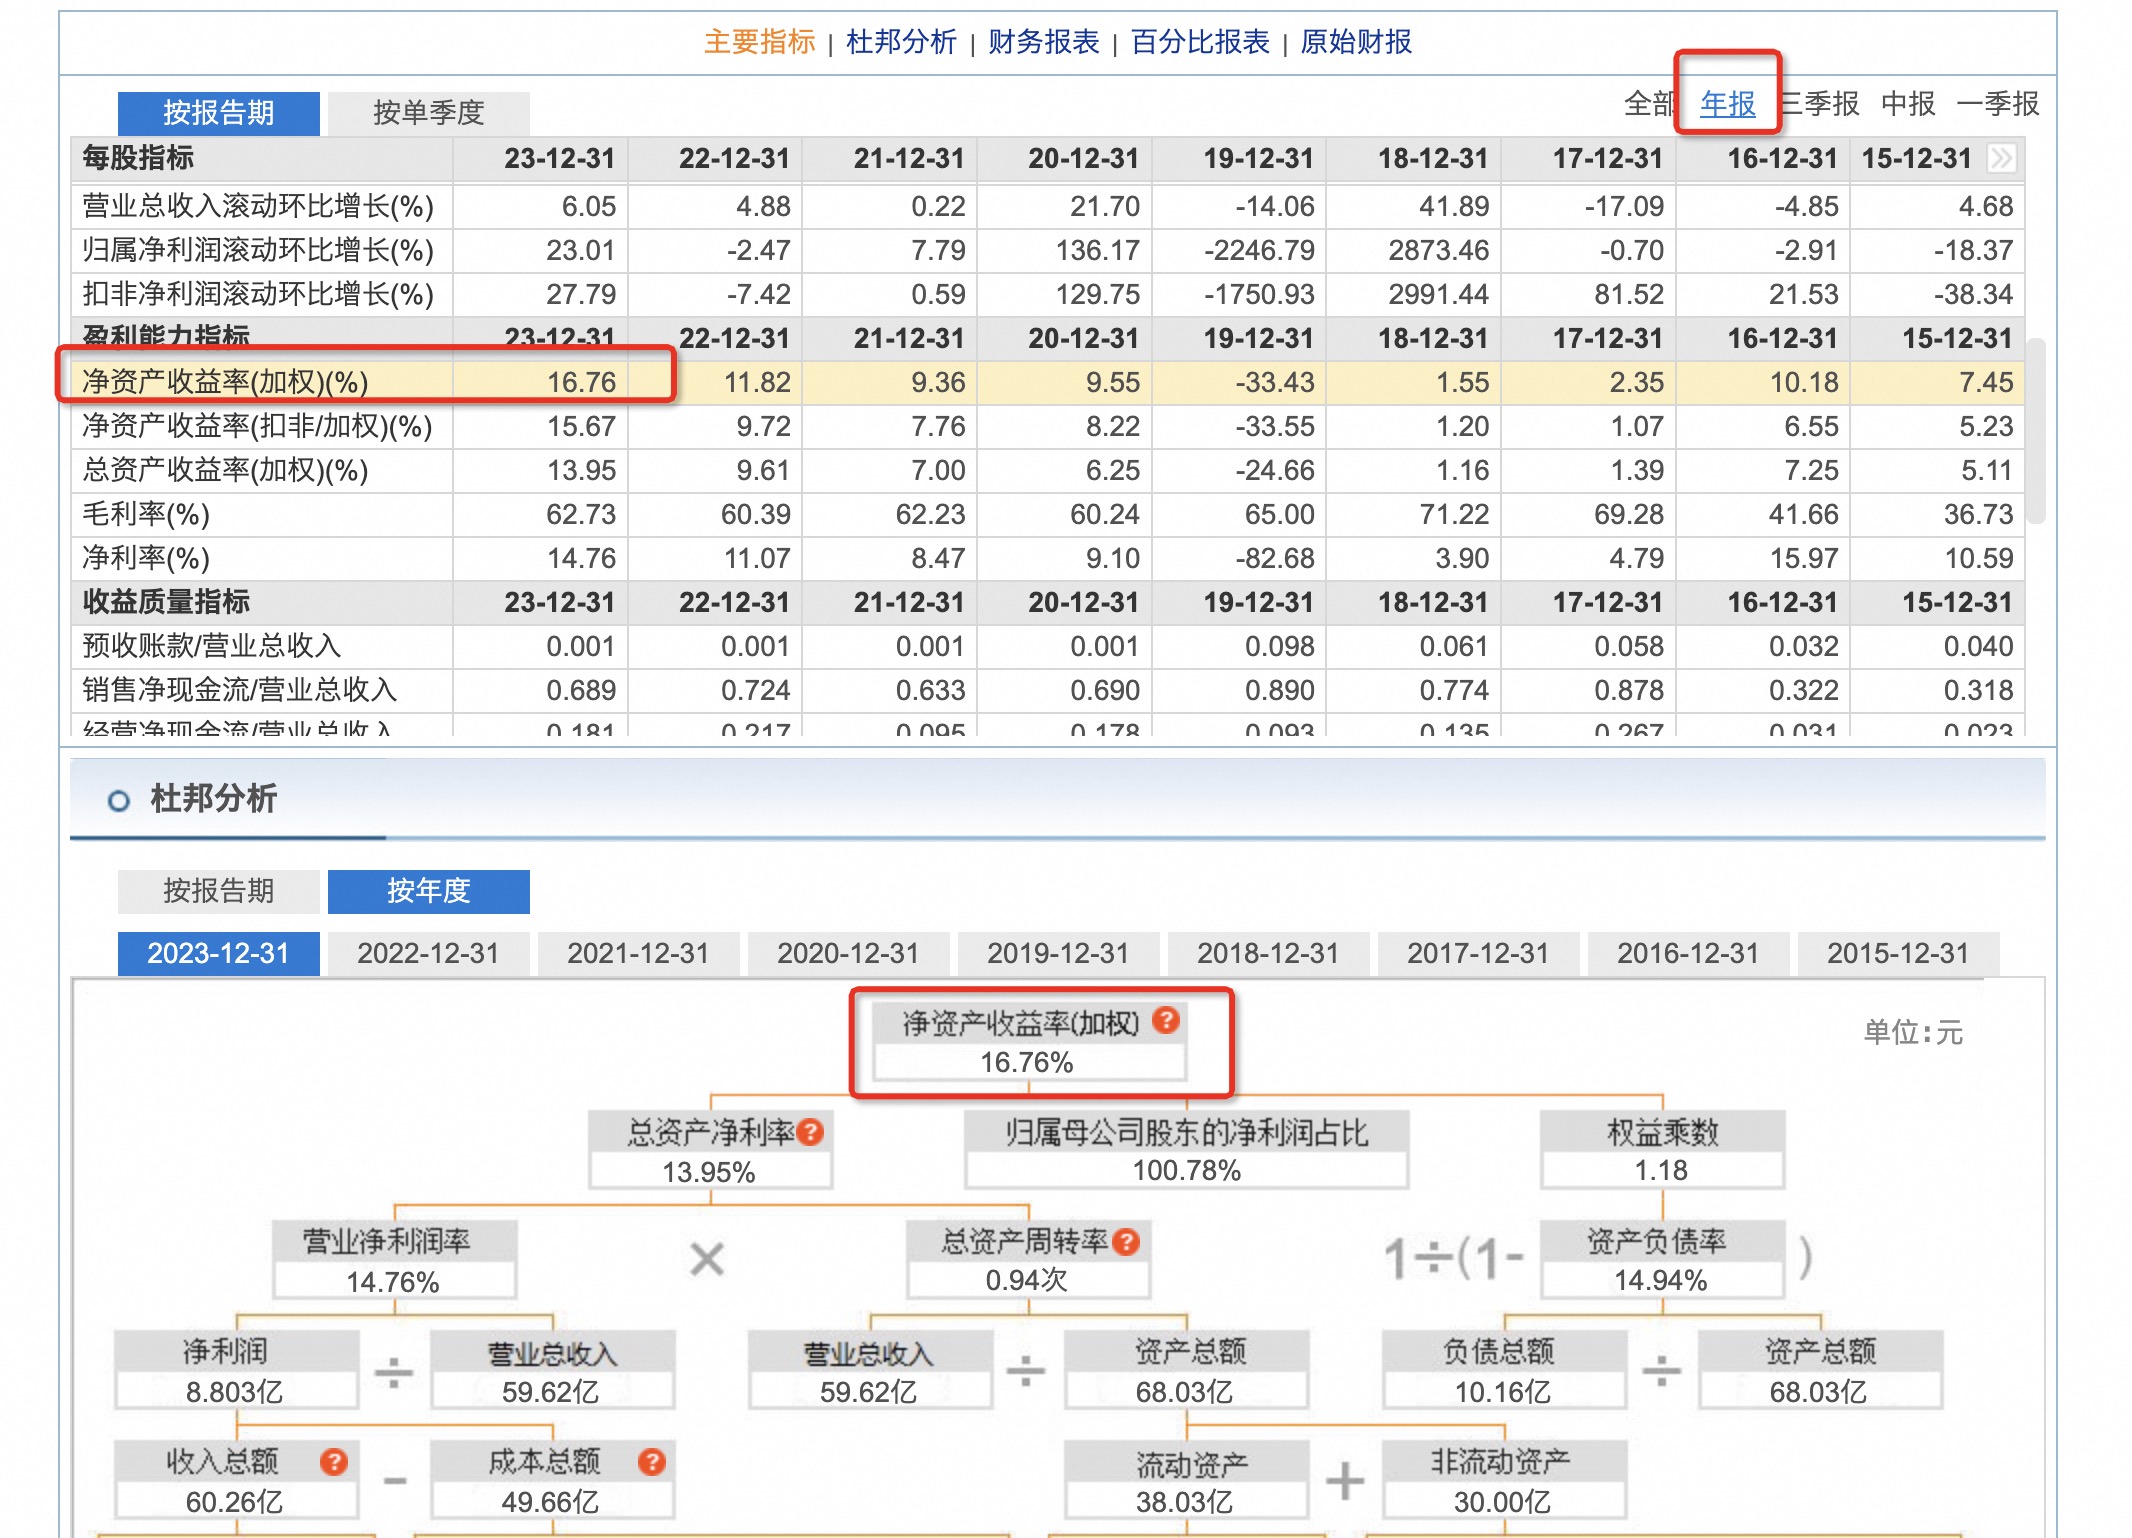
How to view indicators in East Money is shown in the figure below:
Application
A high ROE usually indicates that a company performs well in utilizing shareholders’ equity, making it an important indicator for investors to evaluate a company’s profitability.
PB — Price-to-Book Ratio
A financial indicator used to evaluate a company’s stock value, reflecting the market’s valuation of a company’s net assets per share.
The net assets per share are calculated as follows:
Assuming a company’s current stock price is 50 RMB and net assets per share are 25 RMB, its PB is:
This means investors are willing to pay 2 RMB for every 1 RMB of net assets.
Application
The PB ratio is typically used to assess whether a stock is overvalued or undervalued. Generally speaking, a PB ratio below 1 may indicate that the stock is undervalued, while a value above 1 may indicate it is overvalued.
ROE/PB Ratio — Actual Return on Investment — Inverse of PE
Companies with high ROE and low PB are usually considered to have relatively high investment value because they can provide high returns at lower market prices.
A high ROE/PB ratio may indicate that the company performs excellently in capital utilization efficiency, while its market valuation remains relatively undervalued.
$PE = \frac{(PBB)}{(ROEB)} = \frac{PB}{ROE}$
Application
Assuming a company has an ROE of 30% and a price-to-book ratio (PB) of 20, the actual return rate is 1.5%.
Obviously, a 1.5% return rate is not an attractive deal—it even lags behind fixed-term bank deposits.
If you want to convince someone to withdraw deposits from a bank or bond fund to trade stocks, the return should at least exceed the 5-year fixed-deposit rate, or even be double, to make the risk worthwhile.
Therefore, a safety standard for stock investment requires an investment return rate of no less than 8%.
PE — Price-to-Earnings Ratio
Static PE
The price-to-earnings ratio directly expresses the relationship between an investor’s input and output.
Dynamic PE
The formula above uses past data for calculation, which is why it is called Static PE. Dynamic PE, on the other hand, forecasts the future of the stock.
The denominator of Dynamic PE is the forecasted net profit for the coming year, and the forecasting method can also be applied to the PEG calculation below.
For example, if the stock has already released its Q1 financial report, the denominator in the formula is multiplied by 4; for the semi-annual report, multiplied by 2; and for the Q3 report, multiplied by 4/3.
Assuming a stock’s closing price on that day is 1,000 RMB, and the earnings per share in the Q1 financial report is 10 RMB, the denominator is multiplied by 4 during calculation:
If the Dynamic PE is higher than the Static PE, it may indicate that the stock’s earnings per share and net profit have decreased, which warrants caution.
Trailing Twelve Month PE (TTM)
Similar to Static PE, the denominator of TTM PE is based on the sum of net profits over the last four quarters.
If the net profit of the last four quarters is used, it is also called PE3; if earnings per share is used, it is called PE4.
Application
Assuming a company has a PE of 10, it will take 10 years of holding the stock to recover the investment cost. This means that buying the stock at the current price, assuming the company maintains constant profitability, will take 10 years for the net profit earned (converted according to held shares) to equal the initial money invested in buying the stock.
As mentioned above, the actual return on investment is the inverse of PE, which requires that PE should not exceed 12.5.
PEG
If a company’s stock is fairly priced, its price-to-earnings ratio will equal its earnings growth rate. — Peter Lynch
Lynch believed that stocks with a PEG ratio below 1 may be undervalued, while those above 1 may be overvalued.
PEG is a comprehensive indicator that examines both value and growth potential. Therefore, PEG is particularly suitable for assessing the stock value of growth companies.
PE is calculated based on the “Price-to-Earnings Ratio” indicator, while the G value matches the corresponding value based on the reporting period, similar to the calculation method of Dynamic PE: Q1 report determines growth based on current-year Q1 net profit × 4 compared to the previous year’s net profit; Q2 report determines growth based on current-year interim net profit × 2 compared to the previous year’s net profit, and so forth.
Application
Suppose a stock has a price-to-earnings ratio of 30, and analysts project its earnings growth rate for the next year to be 50%. The PEG ratio for this stock would be just 0.6.
Summary
When I use F10 technical indicators, they are generally used for the first round of stock selection to pick out undervalued stocks with growth potential. In the second round, real-time trend technical indicators like MACD, KDJ, and CII are used.